Crime and Safety in Hillingdon
Last updated: 07 Jun 2026
Hillingdon is among the top 20 most dangerous boroughs in London. The overall crime rate in Hillingdon in 2026 is 81 crimes per 1,000 people. This compares favourably to London's overall crime rate, coming in 2.2% lower than the London rate of 82 per 1,000 daytime population. For England, Wales, and Northern Ireland as a whole, Hillingdon is the 28th safest city, and the 809th most dangerous location out of all towns, cities, and villages.
In January 2026, Hillingdon had the worst crime rate in London for other crime, with 148 crimes reported and a crime rate of 0.38 per 1,000 daytime population. February 2026 was also a bad month for Hillingdon residents, when it was again London's most dangerous area for other crime, recording 148 crimes at a rate of 0.38 per 1,000 daytime population.
The most common crimes in Hillingdon are violence and sexual offences, with 9,776 offences during 2026, giving a crime rate of 25. This is 0.98% higher than 2025's figure of 9,681 offences and a difference of 0.22 from 2025's crime rate of 25. Hillingdon's least common crimes are possession of weapons, with 178 offences recorded in 2026, an increase of 9% from 2025's figure of 163 crimes.
Hillingdon 2026 Crime Scorecard
Top 20 Most Dangerous
Boroughs, London
0.91% higher, regional crime rate
London
12% higher, national crime rate
England, Wales & NI
Local Crime in Context
As of April 2026, the crime rate in Hillingdon is 0.91% higher than London and 12% higher than the England, Wales & Northern Ireland overall figure.
Hillingdon Crime Rate Over Time
| Hillingdon | |
| London | |
| England, Wales & NI |
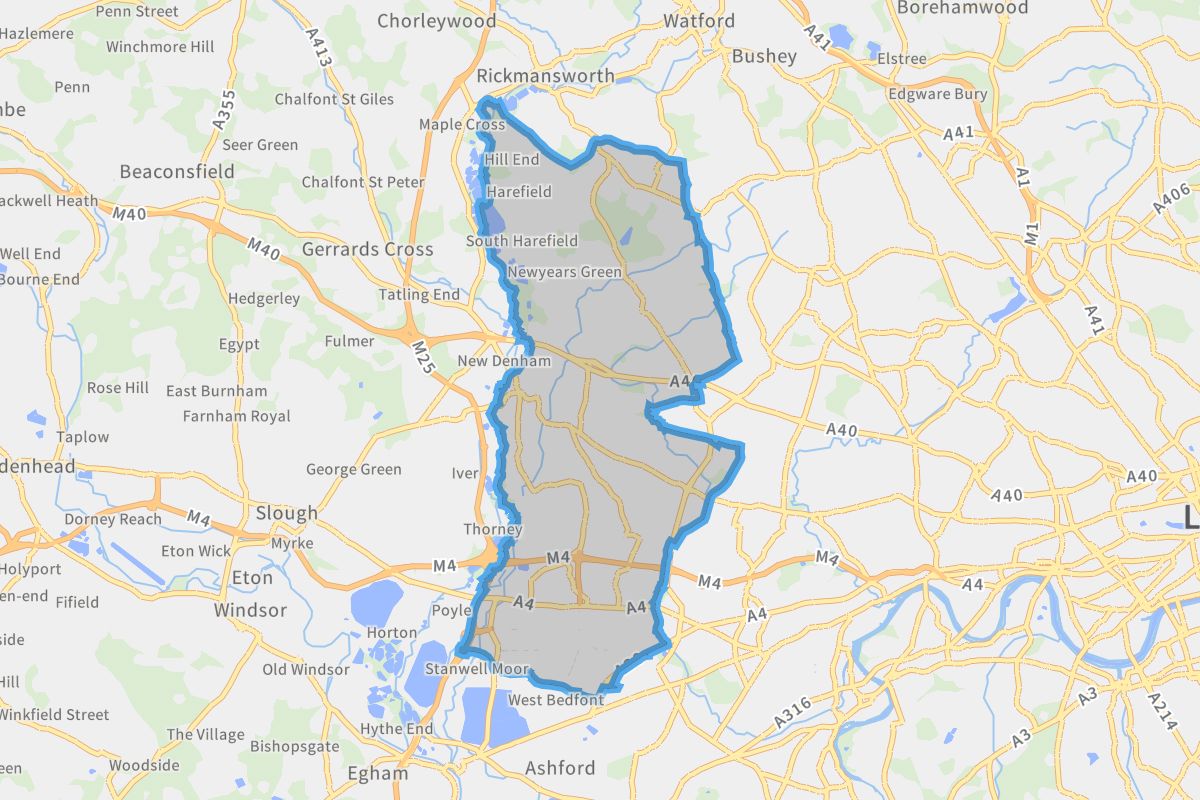
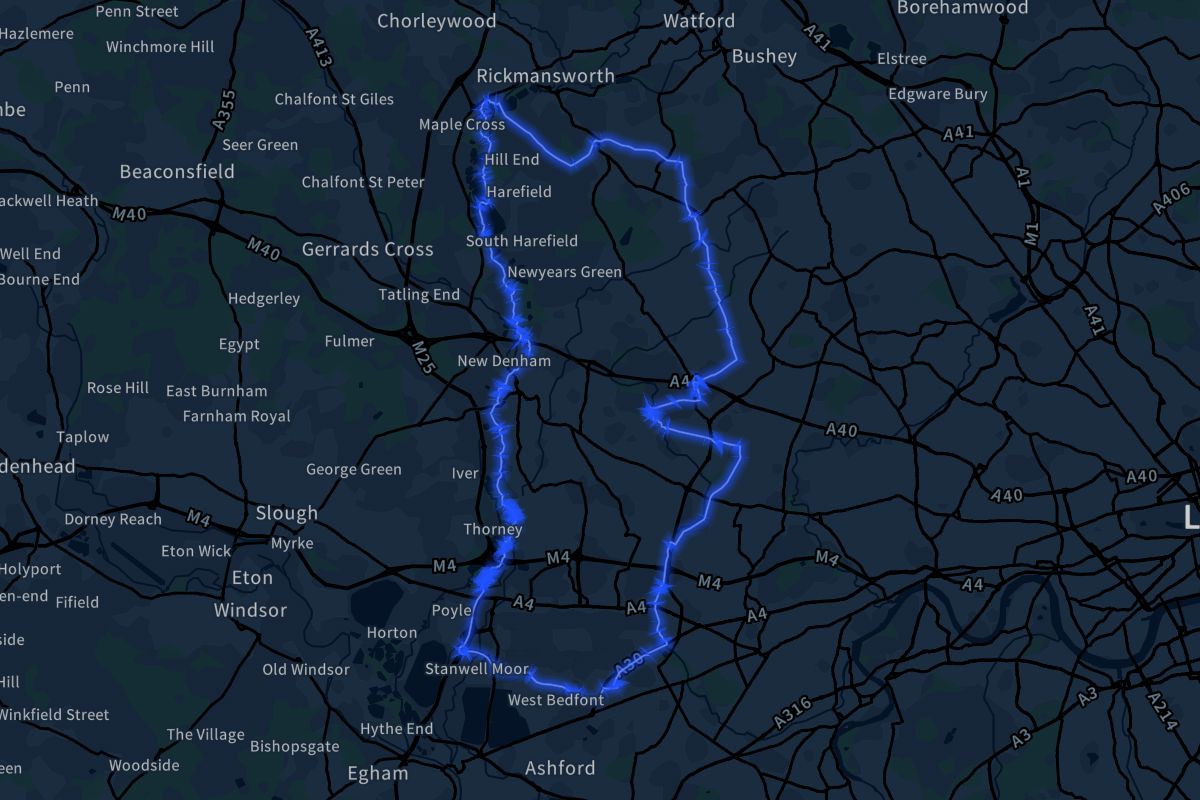
Hillingdon Crime Map
Incidents mapped in Hillingdon represent the time frame between January 2016 and April 2026. Each point on the map represents an area where crimes have been recorded locally.
Use Crime Map
Hover over a point to see a breakdown of crime types recorded at that location. You can also filter by individual crime types, or use a combinations of offences to visualise the data you need.

See How Hillingdon Compares
You can compare Hillingdon's crime statistics against any other town, village, or city from across the country. Search for a location's name below to see how they stack up.

Introduction to Hillingdon's crime statistics
This crime profile provides a detailed view of crime and safety around Hillingdon up to April 2026, the most recent data release available. The crime figures and statistics have been calculated across each of Hillingdon's 6,200 postcodes using three area sizes for comparison:
- Within a Five-Minute Walk
- Within a Ten-Minute Walk
- Within a Fifteen-Minute Walk
Individual crime risk scores and index figures are for the 12-month period ending April 2026 unless otherwise stated.
CrimeRate Insights
Looking into a specific address in Hillingdon? CrimeRate Insights reports convert raw numbers into practical insight for any location, from single addresses and postcodes, up to major towns and cities.
Crime rates don’t happen by themselves; they follow people and patterns. Where crowds gather - near pubs and late-night venues, around the station, by supermarkets and forecourts - incidents naturally concentrate.
That doesn’t mean an area is "bad"; it usually means footfall is higher.
Your report explores these factors in a calm, non-judgemental way, putting the numbers in context and helping you spot what’s typical for places like this.
Crime Risk Scores
Hillingdon • 12 Months Ending April 2026
The typical five-minute walk within Hillingdon has a crime risk score of 520. This is based on analysis of 6,200 nearby areas within Hillingdon, with "most" referring to roughly two thirds of the nearby locations.
Crime risk scores are on a scale of 1 to 1,000 and consider the severity of the crimes involved, as determined by sentencing guidelines. A score of 1 represents the lowest risk, and 1,000 the highest risk. This approach ensures that - unlike overall crime rate figures - bicycle theft is not given the same importance in Hillingdon's risk scores as, for example, robbery, or violence & sexual offences.
Within a five-minute walk of the typical location in Hillingdon, crime risk scores are typically around 520, while in London they are average 534.
Areas within a ten-minute walk typically see crime risk scores of 599 (613 for London), and scores within a fifteen-minute walk are most often around 662 (London 663).
Trends in Crime Risk
Hillingdon
Calculated via Seasonal and Trend decomposition using Loess, the Seasonality Adjusted line represents the original data with seasonality subtracted, and the Trend line has been plotted unadjusted. Overall trend direction has been identified using the Mann-Kendall trend test, and rate calculated from the slope of the best-fit line identified from linear regression.
The 10-year trend indicates a decrease of 17% in Hillingdon's crime risk score. This is potentially a strong signal of how the crime risk is evolving. Cross-referencing with major cultural events and Covid's impact during this time is advised.
Looking at the previous five years, the trend in Hillingdon's crime risk score is up by 11%. While potentially a good indicator of the overall risk trend, analysis may offer further insight when combined with the checks mentioned above.
The risk score trend over the last year has not shown any statistically meaningful movement up or down.
Crime Rates and Indexes
Hillingdon
The CrimeRate Index shows how crime rates compare against the national average.
1.0 equals the average
2.0 is double
3.0 triple
0.5 is half and
0.25 a quarter.
Highest Crime Rates
Hillingdon • 12 Months Ending April 2026
Excluding other crime and other theft because their geographic location is often not relevant, anti-social behaviour as its definition is too wide, and bicycle theft for its specificity.
Vehicle Crime offences have a crime rate of 9.23 reports per 1,000 people in Hillingdon, which is 2.15 times the national average. This figure is calculated from 3,563 crime reports logged by Metropolitan Police during the 12-month period ending April 2026.
For the same period, Metropolitan Police recorded 1,106 reports of Theft From the Person in Hillingdon, resulting in a crime rate of 2.87 reports per 1,000, and a CrimeRate Index of 1.85.
The crime rate for Robbery is 1.52 times the national average at 1.79 reports per 1,000. This is from 691 crime reports reported to Metropolitan Police.
Most Significant 3-Year Increases in Crime Types
Hillingdon
Excluding other crime and other theft, anti-social behaviour, and bicycle theft, and calculated with the same STL method described in Trends in Crime Risk, using CrimeRate Index figures to identify crime types that are trending above or below the national average, and the analysis timeframe limited to the last three years.
Theft From the Person offences are trending upwards, and have a CrimeRate Index of 1.58 for the month of April 2026.
Three years ago, the monthly Theft From the Person CrimeRate Index was 0.69 times the national average, and the current trend indicates an increase of 129% over this timeframe.
Violence and Sexual Offences are trending upwards, and have a CrimeRate Index of 0.76 for the month of April 2026.
Three years ago, the monthly Violence and Sexual Offences CrimeRate Index was 0.75 times the national average, and the current trend indicates an increase of 1.3% over this timeframe.
Shoplifting offences are trending upwards, and have a CrimeRate Index of 1.03 for the month of April 2026.
Three years ago, the monthly Shoplifting CrimeRate Index was 0.72 times the national average, and the current trend indicates an increase of 43% over this timeframe.
Most Significant 3-Year Decreases in Crime Types
Hillingdon
Calculated with the same methodology as the largest increases section above.
No significant decreases identified.
Crime Type Breakdown & Heat Map
Hillingdon • 12 Months Ending April 2026
Size and colour reflect the CrimeRate Index figures for each type of crime.
Hillingdon | London | Metropolitan Police | |||||||
|---|---|---|---|---|---|---|---|---|---|
| Crime Type | Count | Rate | Index | Count | Rate | Index | Count | Rate | Index |
| Anti-Social Behaviour | 8,886 | 23.04 | 1.63 | 235,985 | 21.68 | 1.53 | 236,187 | 21.58 | 1.53 |
| Bicycle Theft | 239 | 0.62 | 0.85 | 13,695 | 1.26 | 1.73 | 13,744 | 1.26 | 1.73 |
| Burglary | 1,410 | 3.66 | 1.17 | 47,359 | 4.34 | 1.39 | 47,451 | 4.33 | 1.38 |
| Criminal Damage and Arson | 2,022 | 5.24 | 0.83 | 54,098 | 4.99 | 0.79 | 54,220 | 4.97 | 0.79 |
| Drugs | 1,626 | 4.22 | 1.37 | 53,167 | 4.87 | 1.58 | 53,280 | 4.85 | 1.57 |
| Other Crime | 2,009 | 5.21 | 2.82 | 13,008 | 1.19 | 0.64 | 13,028 | 1.19 | 0.64 |
| Other Theft | 3,200 | 8.30 | 1.46 | 97,452 | 8.97 | 1.58 | 97,779 | 8.95 | 1.57 |
| Possession of Weapons | 178 | 0.45 | 0.53 | 6,443 | 0.60 | 0.71 | 6,461 | 0.60 | 0.71 |
| Public Order | 2,139 | 5.54 | 0.96 | 60,049 | 5.52 | 0.95 | 60,156 | 5.49 | 0.95 |
| Robbery | 691 | 1.79 | 1.52 | 30,804 | 2.83 | 2.40 | 30,857 | 2.83 | 2.40 |
| Shoplifting | 3,130 | 8.12 | 1.14 | 87,976 | 8.09 | 1.13 | 88,269 | 8.08 | 1.13 |
| Theft From the Person | 1,106 | 2.87 | 1.85 | 77,160 | 7.11 | 4.59 | 77,344 | 7.08 | 4.57 |
| Vehicle Crime | 3,563 | 9.23 | 2.15 | 81,755 | 7.50 | 1.74 | 81,900 | 7.50 | 1.74 |
| Violence and Sexual Offences | 9,776 | 25.36 | 0.83 | 273,434 | 25.12 | 0.83 | 273,897 | 25.04 | 0.82 |
Download | |||||||||
Total Crime by Year
Hillingdon | London | Metropolitan Police | |||||||
|---|---|---|---|---|---|---|---|---|---|
| Year | Count | Rate | Index | Count | Rate | Index | Count | Rate | Index |
| 2026 | 31,089 | 80.61 | 1.12 | 896,400 | 82.39 | 1.14 | 898,386 | 82.17 | 1.14 |
| 2025 | 29,668 | 77.39 | 1.05 | 896,961 | 83.23 | 1.12 | 898,787 | 82.94 | 1.12 |
| 2024 | 28,570 | 75.56 | 1.00 | 900,986 | 84.38 | 1.12 | 902,681 | 84.12 | 1.12 |
| 2023 | 26,535 | 71.49 | 0.90 | 835,471 | 78.98 | 1.00 | 837,244 | 78.79 | 1.00 |
| 2022 | 24,966 | 68.48 | 0.89 | 795,646 | 75.77 | 0.99 | 797,303 | 75.56 | 0.98 |
| 2021 | 24,181 | 66.54 | 0.97 | 727,983 | 69.09 | 1.01 | 729,401 | 68.83 | 1.00 |
| 2020 | 27,671 | 77.50 | 1.05 | 819,467 | 77.66 | 1.05 | 821,362 | 77.41 | 1.04 |
| 2019 | 27,694 | 78.68 | 1.03 | 849,310 | 80.70 | 1.06 | 851,175 | 80.59 | 1.06 |
| 2018 | 27,091 | 77.40 | 1.09 | 810,063 | 77.08 | 1.08 | 811,738 | 76.91 | 1.08 |
| 2017 | 25,413 | 72.80 | 1.14 | 758,160 | 72.41 | 1.13 | 759,755 | 72.22 | 1.13 |
| 2016 | 7,555 | 21.69 | 1.14 | 234,565 | 22.42 | 1.18 | 235,003 | 22.39 | 1.17 |
Download | |||||||||
Hillingdon Compared to Other London Boroughs
12 Months Ending Apr 2026
| Borough | Total Crimes | Crime Rate | Rate Difference |
|---|---|---|---|
| Westminster | 75,198 | 125.02 | 55% more dangerous |
| Southwark | 39,255 | 91.28 | 13% more dangerous |
| Greenwich | 27,583 | 87.11 | 8% more dangerous |
| Brent | 32,653 | 86.45 | 7% more dangerous |
| Enfield | 29,378 | 85.76 | 6% more dangerous |
| Hammersmith and Fulham | 20,786 | 84.88 | 5% more dangerous |
| Barking and Dagenham | 19,666 | 81.12 | 0.63% more dangerous |
| Hillingdon | 31,089 | 80.61 | - |
| Waltham Forest | 23,076 | 80.11 | 0.62% safer |
| Ealing | 32,448 | 77.95 | 3.3% safer |
| Hounslow | 26,744 | 77.29 | 4.1% safer |
| Croydon | 33,841 | 75.52 | 6% safer |
| Redbridge | 24,733 | 73.62 | 9% safer |
| Tower Hamlets | 37,488 | 69.03 | 14% safer |
| Havering | 19,437 | 67.13 | 17% safer |
| Wandsworth | 26,470 | 66.98 | 17% safer |
Comparing Hillingdon to the UK's Major Cities
12 Months Ending Apr 2026
| City Name | Crime Rate | Rate Difference |
|---|---|---|
| Cardiff | 79.55 | 1.3% safer |
| Hillingdon | 80.61 | - |
| Newcastle upon Tyne | 82.69 | 2.6% more dangerous |
| Sheffield | 84.09 | 4.3% more dangerous |
| Leicester | 97.87 | 21% more dangerous |
| Bristol | 104.64 | 30% more dangerous |
| Birmingham | 105.05 | 30% more dangerous |
| Liverpool | 106.48 | 32% more dangerous |
| Leeds | 107.10 | 33% more dangerous |
| Nottingham | 107.74 | 34% more dangerous |
| Westminster | 125.00 | 55% more dangerous |
CrimeRate Pro
To download charts and tables, you must subscribed to CrimeRate Pro
You can find out more, or get a CrimeRate Insights report that includes further analysis.
Offences In and Around Hillingdon's Parks & Leisure Spaces
Limited to spaces in Hillingdon that are named and have had crimes recorded within their boundaries in the 12 months to Apr 2026.
| Name | ASB | Drugs | Public Order | Robbery | VSO | All Others |
|---|---|---|---|---|---|---|
| Brackenbridge Field | 5 | 1 | - | - | 1 | 11 |
| Lord Halsbury Memorial Playing Fields | 20 | 1 | 2 | 2 | 37 | 34 |
| Warren Park | - | 12 | 3 | - | 6 | 16 |
| Stockley Country Park | 8 | 1 | 4 | - | 8 | 11 |
| Bell House Field | 26 | 2 | 3 | 2 | 7 | 13 |
| Botwell Green Sports and Leisure Centre | 50 | 11 | 26 | 13 | 69 | 179 |
| Batchworth Heath | 3 | - | - | - | 6 | 4 |
| The Green | 18 | 1 | 3 | 3 | 9 | 35 |
| Ickenham Green | 8 | - | 1 | - | 2 | 4 |
| Uxbridge Common | 8 | 5 | - | - | 9 | 6 |
| Coney Green | 13 | - | - | - | 7 | 8 |
| The Green | 12 | - | - | 2 | 13 | 20 |
| The Green | 2 | - | - | - | 2 | 9 |
| Harmondsworth Moor | 10 | 8 | 1 | - | 14 | 18 |
| London Tigers | 20 | 2 | 5 | 7 | 29 | 18 |
| Brentford Academy | 6 | 1 | 5 | - | 13 | 13 |
| Dowding Park | 17 | - | 2 | - | 12 | 31 |
| Willow Tree Open Space | 17 | 1 | 10 | 12 | 32 | 151 |
| Hale Field Park | 1 | 3 | 1 | 1 | 5 | 9 |
| Denham Country Park | 1 | - | - | - | 7 | 11 |
| Fassnidge Park | 26 | 5 | 8 | 4 | 12 | 24 |
| Barnsfield Place Allotments | 19 | 8 | 4 | 2 | 17 | 11 |
| Honeycroft Hill Allotments | - | 2 | - | 1 | 6 | 14 |
| Cowley Hall Recreation Ground | 35 | 4 | 1 | 4 | 25 | 39 |
| Peachey Lane Allotments | 15 | - | - | - | 2 | 2 |
| Ickenham Green Allotments | 6 | - | 1 | - | 1 | 1 |
| Hillingdon Sports and Leisure Complex | 23 | 13 | 10 | 2 | 33 | 31 |
| Glebe Avenue Allotments | 2 | 1 | - | - | 4 | 7 |
| Western Avenue Allotments | 7 | 1 | - | - | 6 | 1 |
| Southbourne Gardens Allotments | 2 | 2 | 2 | - | 11 | 5 |
| New Pond Playing Fields | 10 | 3 | 1 | - | 9 | 15 |
| Bessingby Playing Fields | 1 | 2 | 1 | - | 1 | 3 |
| Cavendish Recreation Ground | 7 | 1 | 1 | 1 | 3 | 5 |
| Pine Gardens | 2 | 4 | 2 | 1 | 4 | 9 |
| Roxbourne Park | 17 | 1 | 5 | 2 | 18 | 19 |
| Field End Road Allotments | 5 | - | 1 | 2 | 3 | 6 |
| The Fairway Allotments | 13 | 1 | - | 1 | 4 | 6 |
| Queensmead Sports Centre | 6 | 1 | 2 | 4 | 12 | 49 |
| Deane Park | 4 | - | - | - | - | 7 |
| Hillingdon Court Park | 10 | 3 | 2 | - | 4 | 11 |
| Hillingdon Cemetery | 9 | - | 1 | - | 5 | 5 |
| Uxbridge Cemetery | 5 | 1 | - | - | 9 | 11 |
| Brunel University Playing Fields | 1 | 1 | - | - | 6 | 7 |
| Pield Heath Road Allotments | 16 | 1 | 3 | 1 | 5 | 10 |
| Hayes Park | - | - | - | - | 6 | 5 |
| Connaught Recreation Ground | 19 | 2 | 7 | 1 | 33 | 27 |
| Hayes End Allotments | - | - | - | - | 2 | 10 |
| Wood End Green Allotments | 13 | 2 | 3 | - | 12 | 11 |
| Grosvenor Playing Field | 2 | - | - | 1 | 14 | 17 |
| Grange Park | 50 | 17 | 7 | 6 | 43 | 61 |
| The Closes | 11 | 2 | 2 | 2 | 14 | 22 |
| Barra Hall Park | 32 | 6 | 8 | 2 | 20 | 27 |
| West Drayton Depot Allotments | 5 | 2 | - | - | 8 | 8 |
| West Drayton Cemetery Allotments | 3 | - | 1 | - | 1 | 0 |
| Stockley Recreation Ground | 19 | 9 | 7 | - | 19 | 24 |
| Bourne Farm Playing Field | 31 | 6 | 4 | 1 | 11 | 20 |
| Pinkwell Park | 10 | 1 | 4 | 2 | 14 | 22 |
| Sam Philp Recreation Ground | 45 | 1 | 16 | 1 | 50 | 16 |
| Lake Gardens | 1 | 2 | 5 | - | 25 | 16 |
| Hayes Bridge Allotments | 38 | 3 | 7 | 1 | 33 | 17 |
| Station Road Allotments | 15 | 2 | 6 | 1 | 46 | 28 |
| Harmondsworth War Memorial Recreation Ground | 6 | 3 | 4 | 1 | 15 | 41 |
| William Byrd Pool | 1 | - | 1 | - | - | 2 |
| Avenue Park | 12 | - | 4 | 1 | 22 | 18 |
| Taylors Meadow | 13 | 1 | 5 | - | 6 | 14 |
| Poors Lane Allotments | - | - | - | - | 2 | 2 |
| Church Hill Allotments | 3 | - | 2 | 1 | 6 | 3 |
| Highfield Crescent Allotments | 1 | - | - | - | 9 | 4 |
| Bayhurst Wood Country Park | 24 | - | - | - | 1 | 0 |
| The Middlesex Stadium | 2 | - | 2 | - | 4 | 5 |
| Meadway Allotments | - | - | - | 1 | - | 3 |
| Pinn Way Allotments | - | - | - | 1 | - | 3 |
| Kings Gardens | 1 | 1 | 2 | - | 8 | 4 |
| Church Field Gardens | 4 | 2 | 16 | 6 | 16 | 67 |
| Poor's Field | - | 3 | 5 | 1 | 6 | 35 |
| Rodney Garden Allotments | - | - | - | - | 1 | 1 |
| Kings College Playing Fields | 8 | - | 1 | - | 5 | 6 |
| Highgrove Allotments | 33 | - | - | - | 2 | 2 |
| Warrender Park | 6 | 1 | - | 2 | 5 | 3 |
| Huntsmoor Park | - | 3 | - | - | 1 | 5 |
| Ruislip Gardens | 4 | - | 3 | - | 3 | 5 |
| Old Abbots Rugby Football Club | 6 | 1 | - | - | 19 | 7 |
| Knights Gardens | 7 | 2 | 5 | - | 26 | 22 |
| Belmore Allotments | - | - | 1 | - | 3 | 5 |
| Stockley Park | 2 | 9 | 6 | - | 11 | 11 |
| Lake Farm Country Park | 46 | 7 | 7 | 4 | 40 | 29 |
| Minet Country Park | - | 1 | 1 | - | 3 | 2 |
| Cranford Park | 19 | 17 | 1 | 5 | 34 | 47 |
| Engineer's Wharf | 34 | 21 | - | 2 | 36 | 31 |
| Northwood Cemetery | - | - | - | - | - | 2 |
| Northwood Recreation Ground | 56 | - | 1 | 1 | 8 | 12 |
| Eastcote House Gardens | 2 | - | - | - | 1 | 5 |
| King George's Field | 16 | - | 5 | - | 21 | 8 |
| Autumn Green | 13 | - | 2 | - | 16 | 12 |
| Cuckoo Hill | - | - | - | - | - | 1 |
| Bishops Wood Country Park | 1 | - | 1 | - | 2 | 0 |
| Golden Park | 4 | - | 1 | 3 | 11 | 18 |
| Breakspear Crematorium and Gardens of Remembrance | 3 | 12 | - | - | 12 | 35 |
Recent Crimes in Hillingdon
The 20 most recent crime reports in Hillingdon.
| Date | Crime Type | Location | Outcome |
|---|---|---|---|
| April 2026 | Anti-social behaviour | On or near Long Drive | |
| April 2026 | Anti-social behaviour | On or near Long Drive | |
| April 2026 | Anti-social behaviour | On or near Brickfields Way | |
| April 2026 | Other crime | On or near Shopping Area | |
| April 2026 | Other crime | On or near Shopping Area | |
| April 2026 | Other crime | On or near Shopping Area | |
| April 2026 | Other theft | On or near Shopping Area | |
| April 2026 | Other theft | On or near Shopping Area | |
| April 2026 | Possession of weapons | On or near Shopping Area | |
| April 2026 | Possession of weapons | On or near Heather Lane | |
| April 2026 | Public order | On or near Shopping Area | |
| April 2026 | Public order | On or near Shopping Area | |
| April 2026 | Public order | On or near Petworth Gardens | |
| April 2026 | Public order | On or near Petworth Gardens | |
| April 2026 | Shoplifting | On or near Shopping Area | |
| April 2026 | Vehicle crime | On or near Little Benty | |
| April 2026 | Violence and sexual offences | On or near Heather Lane | |
| April 2026 | Violence and sexual offences | On or near Heather Lane | |
| April 2026 | Violence and sexual offences | On or near Little Benty | |
| April 2026 | Violence and sexual offences | On or near Charville Lane West |
Methodology & Data Sources
Hillingdon Crime Report
Data Sources & Processing
Every month, CrimeRate processes crime reports from data.police.uk, the UK's official provider of open crime report data. Each crime report includes anonymised coordinates, most often "snapped" to the middle of the nearest street, or to the nearest major landmark. The reports also include the month and year the crime was reported, as well as the type of crime.
Data releases on data.police.uk happen once a month, with a two-month delay. This means that, for example, crimes reported in Hillingdon during August 2026 will typically become available in October 2026. The latest release is for Apr 2026 and was released in Jun 2026. To provide current and historical crime statistics, CrimeRate processed 61,669,232 crime reports for the latest release.
Hillingdon Data Points
For Hillingdon, CrimeRate uses the geographic boundaries provided by The Office for National Statistics in the December 2023 release of their Parishes and Non Civil Parished Areas dataset, using the PARNCP23CD column value E43000207.
Due to the 2021 Census being conducted during a UK-wide Coronavirus lockdown, the daytime population figures released so far cannot be relied on for purposes such as comparing crime rates. Instead, CrimeRate uses Hillingdon's daytime - or "workday" - population of 308,708 from the ONS 2011 Census for calculations throughout the site.
All geographic boundaries use the full resolution - extent of the realm versions where provided to avoid missing crime reports near coastlines and rivers - the banks of the Thames in particular - that would otherwise not be included when using the clipped to the coastline datasets.
Calculating Crime Rates
CrimeRate locates the UK region, county, and town/city/village locality for each crime report, and calculates the crime rate by taking the sum of all crime reports, dividing it by the locality's daytime / "workday" population, and multiplying the result by 1,000 to get the crime rate per 1,000.
Crime Risk Score Calculations
CrimeRate calculates crime counts for local, nearby, and wider areas for every postcode in England, Wales, and Northern Ireland. The postcodes locations are deduplicated by a process that ensures distinct points are approximately 50 metres apart. This process removes the bias that would otherwise come from counting the same crimes several times in heavily populated areas.
Using a custom algorithm developed in-house, CrimeRate applies a crime severity weighting to each area's crime counts, based on the type of crime reported. This increases or decreases the crime count, or zeroes it out entirely, depending on the crime type. A separate crime severity rate is then calculated, standardised, and scaled to fit the crime risk score range of 1 to 1,000, with 1 being the lowest score, and 1,000 the highest.
Crime risk scores undergo further analysis per town, city, and village plus other areas including police forces and neighbourhoods. CrimeRate uses percentiles to work out the most common range of crime risk scores in each locality. This includes identifying the high and low bounds where approximately 68% of scores fall, and finding the median (50th percentile) for easy reference.
The crime types with a weight of zero are: Anti-Social Behaviour; Bicycle Theft; Other Crime; Other Theft; and Shoplifting. The highest weights to are assigned to Violence & Sexual Offences, and the lowest to Vehicle Crime.
Frequently Asked Questions
Crime in Hillingdon